Phase 7: BAM > Process analysis
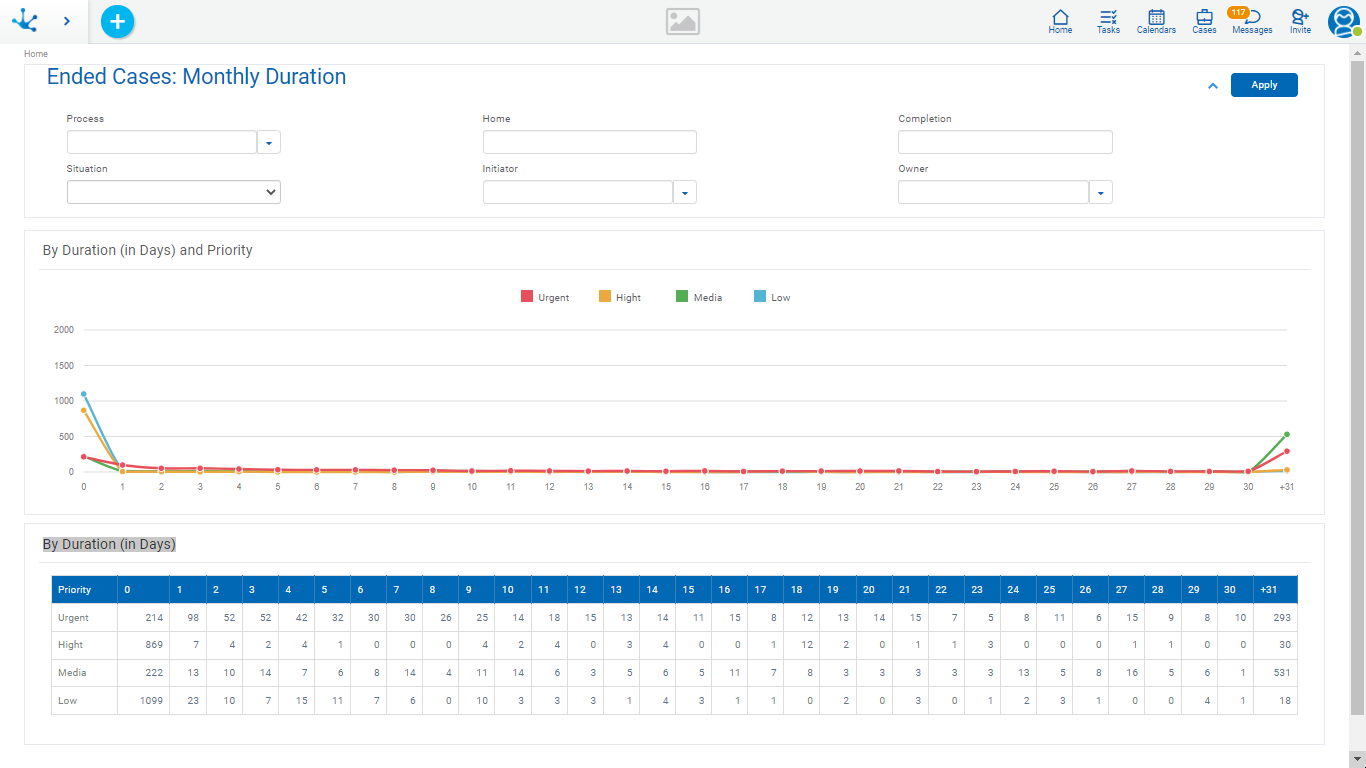
The report on distribution of cases by duration must show a chart similar to a Gaussian bell, where the center of the bell is the average duration, provided that the behavior of the processes is adequate.
To analyze behavior in detail, drill down on the values of the grid in order to reach the cases that make up each value.
The information can be displayed by applying the search filters shown in the upper section of the report.