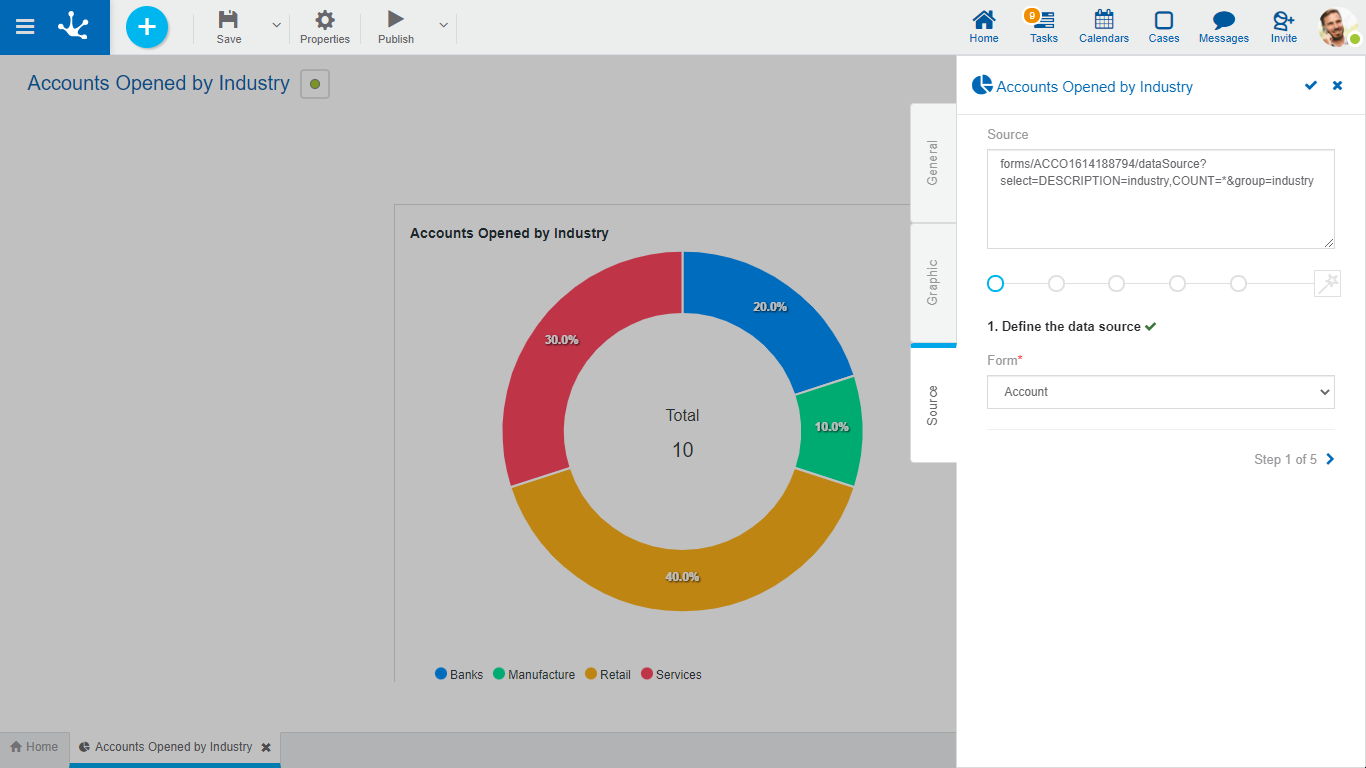
The third tab of the side panel corresponds to the Rest API for obtaining the data of the selected graphic and the wizard for its automatic generation, following a series of steps.
Properties
Source
Corresponds to the URI on the Rest API to obtain the data displayed on the selected graphic. It can be codified or automatically generated through the wizard steps.
Wizard for Widgets Modeling
Allows to automatically generate the URI of the Rest API in the area of the source following the sequence of steps represented by the lines of circles.
Each step is identified by a number and accompanied by an informative paragraph, represented by the “i” icon.
The required steps are represented by the red circle and once they are completed they are displayed in light blue, indicating that the part corresponding to the source code has been completed. The circles corresponding to the steps not yet completed are displayed in grey.
You must respect the pre-established order and advance by selecting the next circle or by pressing the paging icon, located at the bottom of the wizard. You can navigate between the completed steps by pressing the circles or by using the paging icon.
Wizard Steps for Widgets Modeling
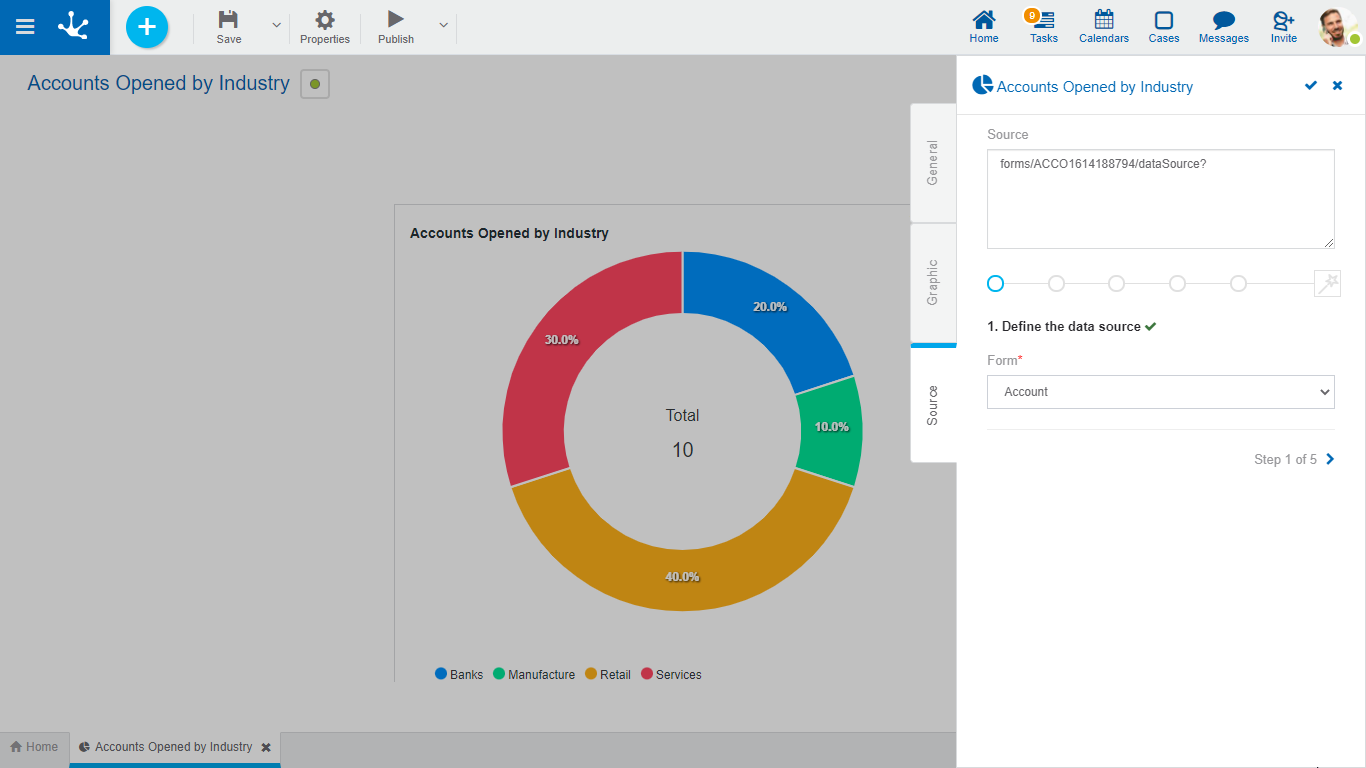
Step 1: Define the data source
This step is required.
Form
Allows to select the entity from which the data to be displayed on the graphic will be taken. Once it is selected there is a check mark to the right of the step description, indicating that it was completed successfully.
When finishing the step, the generated code is displayed on the source.
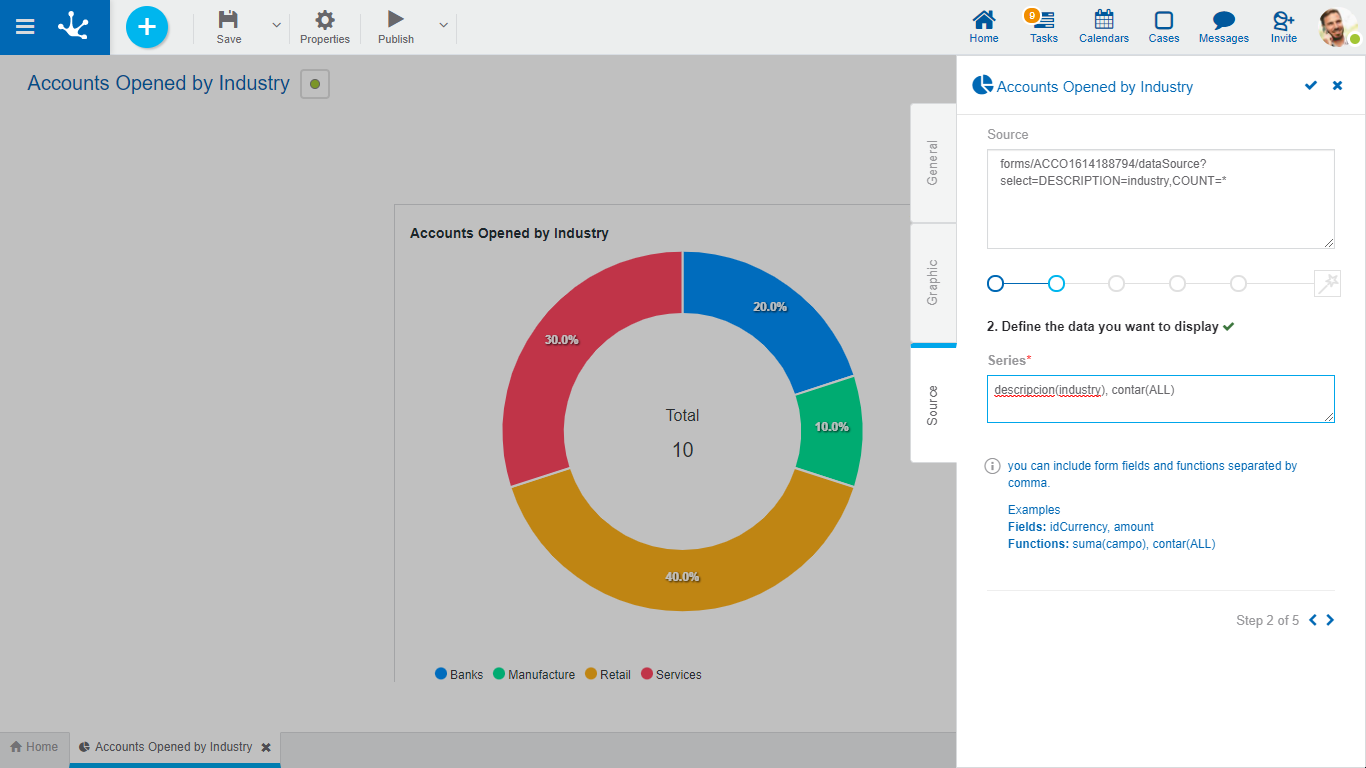
Step 2: Define the data you want to display.
This step is required.
Series
It must be indicated which elements are going to be displayed on the graphic, being able to use the help of the wizard. Once the series are entered, there is a check mark to the right of the step description, indicating that it was completed successfully. When completing the series, the added code is displayed on the source.
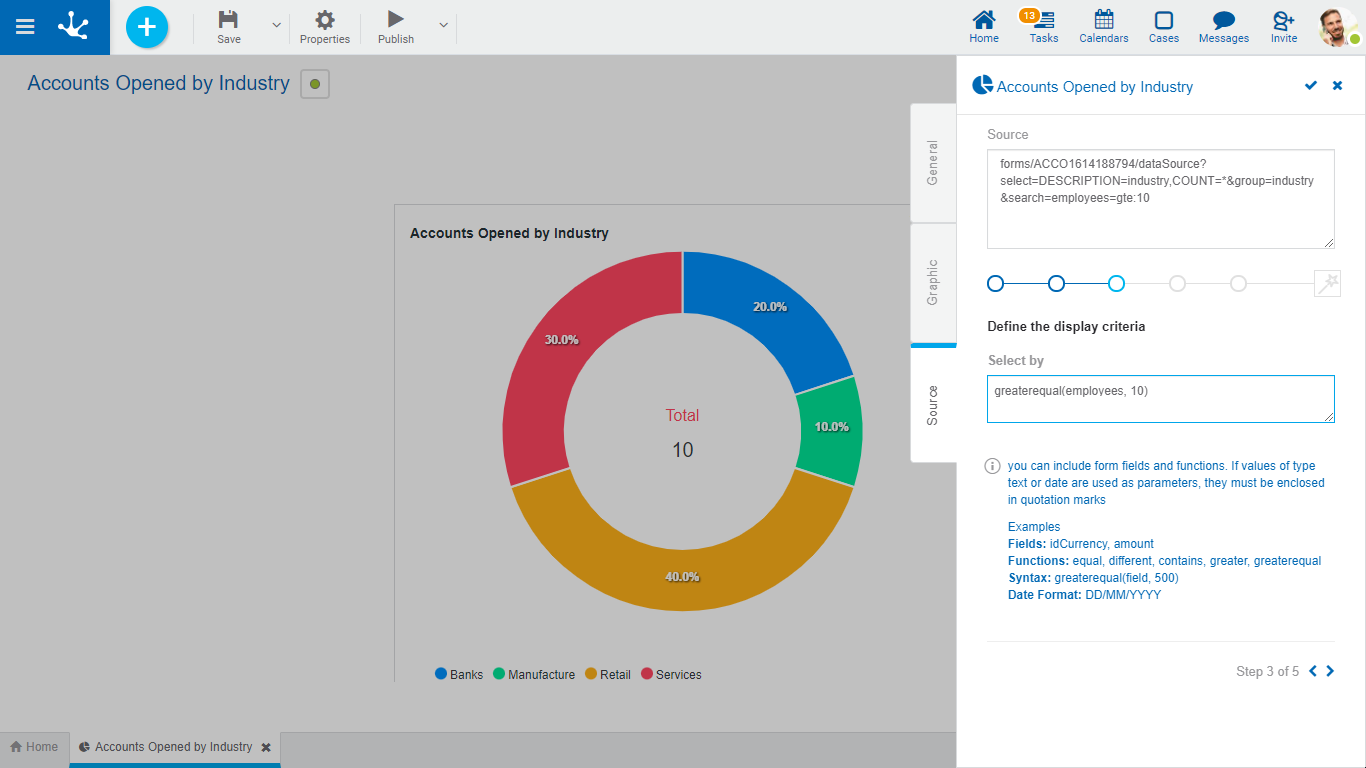
Step 3: Define display criteria.
This step is optional.
Select by
Allows to indicate with the help of the wizard the elements that must meet a condition for the data to be displayed on the graphic.
When completing this step, the added code is displayed on the source.
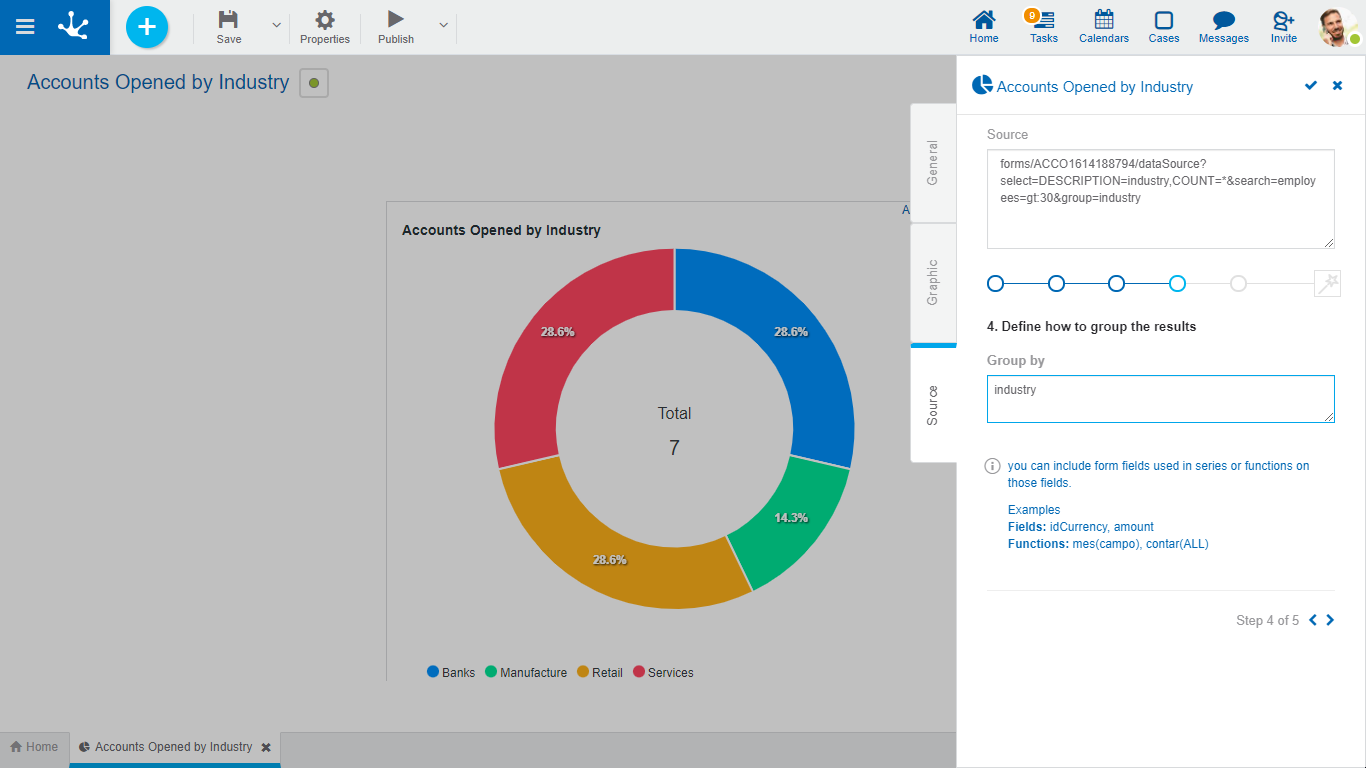
Step 4: Define how to group the results.
This step is optional.
Group by
Allows to indicate with the help of the wizard the elements of the series, by which the results will be grouped.
When completing this step, the added code is displayed on the source.
Step 5: Good job.
Informs that all the steps have been completed, and reminds that changes made on the indicator properties panel must be saved.
